TL:DR: Our conclusions about users’ earnings on jobtech platforms depend heavily on our measurement approach. We tested 6+ methods and chose one that holds steady when new platforms join our portfolio, even ones with unusually high or low earnings.
Our definition of a “quality job” adapts earnings thresholds for size and regularity of earnings, based on the work and the user. But as an ecosystem-building initiative, we are consistently asked to draw out more general lessons about earnings, across the diversity of platforms we’ve worked with.
But working in the jobtech ecosystem means working with platforms that are extremely different from each other, the first of our 10 truths about jobtech. Platforms help improve users’ livelihoods in different ways. In our portfolio, for example, Tana connects ICT professionals to full-time employment, Bumpa helps MSMEs run more efficiently, and Twiva connects creators to influencer gigs. Because of this, we have more than 50 different methods for calculating a quality job, on more than 50 platforms.
So while we have month-by-month earning data on over 250,000 of their users, coming up with generalisable learnings across such a large and diverse dataset can be challenging.
There’s (a median) method to the madness
Remember Charles Wheelan’s ‘Bill Gates walks into a bar’ example from Naked Statistics. Ten people on bar stools each earn $35,000 a year, so the average income is $35,000. Then Bill Gates sits down, and the average jumps to about $91 million, even though no one in the bar is any richer.
This is a classic mathematical comment on the weakness of using mean averages when dealing with individual outliers; the mean shifts drastically when Bill Gates walks in, but the median (the assessment of the ‘middle value’ of the 11 in the bar) remains unchanged.
Platform earnings data follows the same logic:
- A user can have a few unusually good or bad months.
- The same platform can have a few very high earners and many very low ones, or what we call microearners, often averaging 75% of all earners.
- Platform models can often cause winner-takes-all outcomes, where a small number of users deliver most of the jobs on a platform.
- One platform can have far higher or lower earning averages than other platforms.
Each of these dynamics pulls away from what is “typical”. That’s why we in general use the median, the middle value, which those extremes barely move – one platform, or even a few, should not change what is true about a whole sector.
But medians can get very tricky when we pool different groups. Let’s use a hypothetical example from the creative industries. Platform X works with 10,000 nano influencers who each earn about $10 a month. Platform Y works with 10,001 macro influencers who each earn about $100. Pool them and the median is $100, only because Y has one more user than X. Remove two of Y’s influencers and it drops to $10. Work out each platform’s median separately, then take the middle of those two, and you land on $55, a figure nobody on either platform actually earns. So what do creative platforms typically pay: $10, $55 or $100? Each answer depends on how you add up the numbers, and each hides the fact that there are two very different groups underneath.
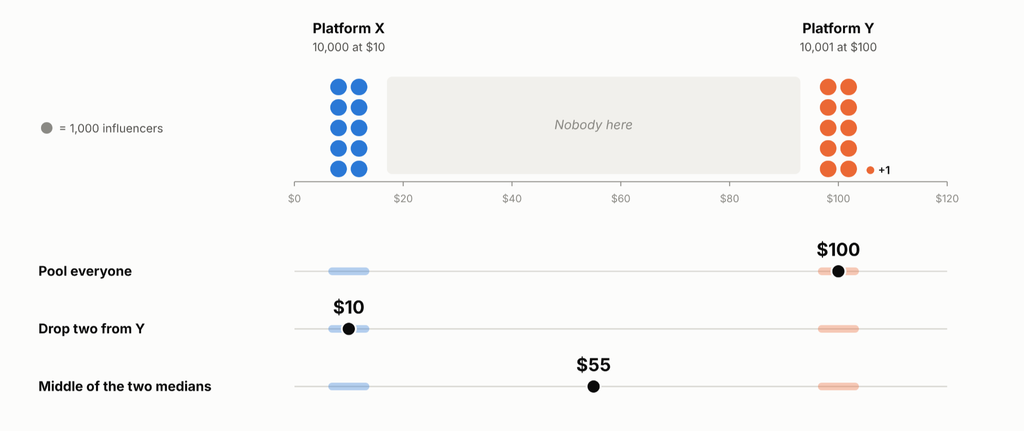
That example shows the two main ways to combine earnings across platforms.
The first is to pool every user into one long list and take the median. We call this the un-nested median. It is simple, but the biggest platform decides the answer, and a handful of users can flip it, as Platform Y above did.
The second is to find the median for each platform first, then take the median of those platform figures. We call this the nested median. Every platform gets one “vote”, so to speak, whatever its size. It’s a bit more democratic.
The table below crosses these choices to answer one question. How much do women earn compared to men on jobtech platforms? Each figure is women’s earnings divided by men’s. 1.00x means they earn the same. 2.00x means women earn twice as much, and 0.50x means half. Read across a row to see how much the answer depends on the method. Read down a column to see how steady each method stays over time.
We also chose which users to count: include everyone; leave out microearners; or only use platforms with enough women and men to compare them fairly.
The values below represent the ratio of women’s earnings compared to men’s.
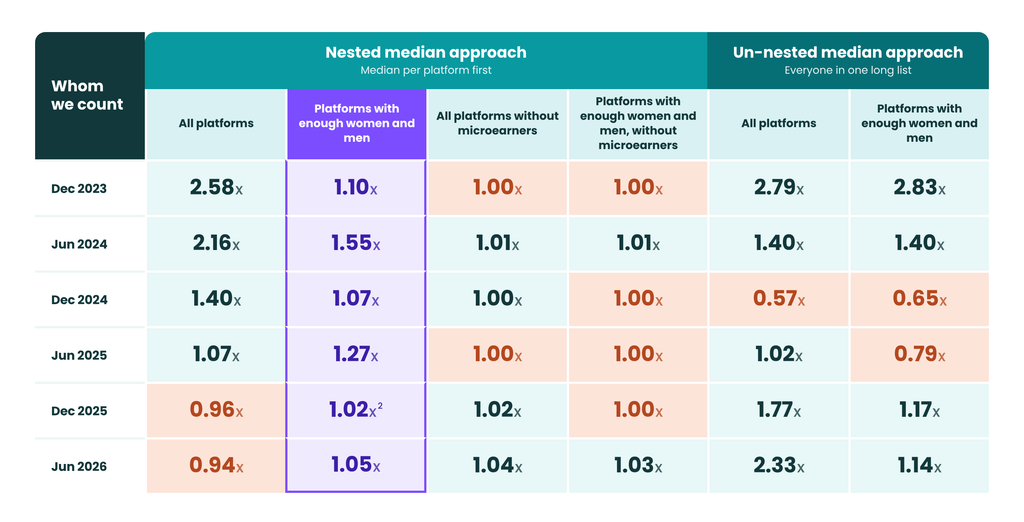
We ended up choosing the method that only considers platforms with sufficient gender representation, achieving reliable earnings comparisons between women and men over time. This holds steady, enabling us to draw out more general lessons about earnings across the diverse platforms we‘ve worked with.
Our method in three simple(ish) steps
As we experimented with all these different ways of calculating results, we saw the overall picture shift sharply when a single platform joined or left our portfolio (and dataset). If one platform could move the answer that much, the calculation method was leaning too heavily on it. That is why we ultimately settled on an approach that stayed steady as individual platforms joined or left.
To get there, we work in three steps, each building on the last:
- First, we look at the individual user. We take what a single user earns, month by month, across the entire period, and find the median. We use the median and not the mean to get each individual’s ‘average’ earnings.
- Second, we take the median of each platform users’ typical (median) earnings. This gives a value for the platform that is not pulled down by a few low earners, or up by a few high earners.
- Third, we take the median of platform-level earnings across the portfolio. Each platform first gets a single figure, the median earnings of users on that platform. We then rank these figures from lowest to highest and take the median. This gives us the earnings on a typical platform in our portfolio, so the value is not skewed towards one more than another.
When a delivery rider and an influencer land in the same spreadsheet, we need to have a solid enough method that helps say something real about what jobtech pays. We did this nerdy methodology part so that next we can get to the good, juicy stuff.
Reach out if you love nerding out and want to find out more.